|
600
|
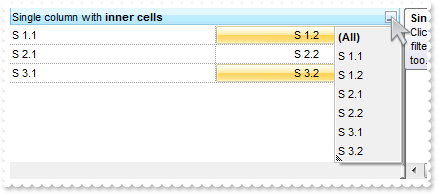
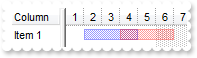
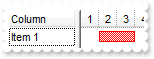
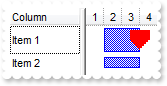
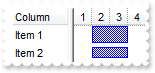
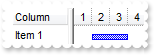
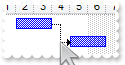
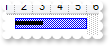
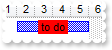
How can include the values in the inner cells in the drop down filter window
With Gantt1
	.DrawGridLines = exRowLines
	.VisualAppearance.Add 1,"c:\exontrol\images\normal.ebn"
	.Description(exFilterBarBlanks) = ""
	.Description(exFilterBarNonBlanks) = ""
	With .Columns.Add("Single Column")
		.HTMLCaption = "Single column with <b>inner cells</b>"
		.ToolTip = "Click the drop down filter button, and the filter list includes the inner cells values too."
		.DisplayFilterButton = True
		.DisplayFilterPattern = False
		.FilterList = exIncludeInnerCells
	End With
	.ShowFocusRect = False
	With .Items
		s = .SplitCell(.AddItem("S 1.1"),0)
		.CellCaption(,s) = "S 1.2"
		.CellHAlignment(,s) = CenterAlignment
		.CellBackColor(,s) = &H1000000
		.CellWidth(,s) = 84
		s = .SplitCell(.AddItem("S 2.1"),0)
		.CellCaption(,s) = "S 2.2"
		.CellHAlignment(,s) = CenterAlignment
		.CellWidth(,s) = 84
		s = .SplitCell(.AddItem("S 3.1"),0)
		.CellCaption(,s) = "S 3.2"
		.CellHAlignment(,s) = CenterAlignment
		.CellBackColor(,s) = &H1000000
		.CellWidth(,s) = 84
	End With
End With
|
|
599
|
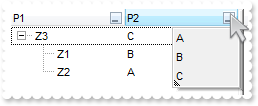
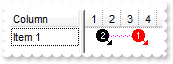
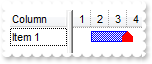
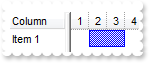
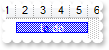
How can I sort the value gets listed in the drop down filter window
With Gantt1
	.LinesAtRoot = exLinesAtRoot
	.MarkSearchColumn = False
	.Description(exFilterBarAll) = ""
	.Description(exFilterBarBlanks) = ""
	.Description(exFilterBarNonBlanks) = ""
	With .Columns.Add("P1")
		.DisplayFilterButton = True
		.DisplayFilterPattern = False
		.FilterList = exSortItemsDesc
	End With
	With .Columns.Add("P2")
		.DisplayFilterButton = True
		.DisplayFilterPattern = False
		.FilterList = exSortItemsAsc
	End With
	With .Items
		h = .AddItem("Z3")
		.CellCaption(h,1) = "C"
		.CellCaption(.InsertItem(h,,"Z1"),1) = "B"
		.CellCaption(.InsertItem(h,,"Z2"),1) = "A"
		.ExpandItem(h) = True
	End With
End With
|
|
598
|
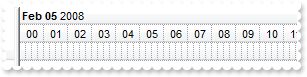
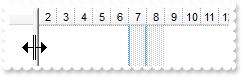
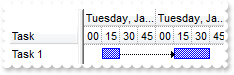
Is there a way to break the hours into 15 minute increments just showing lines instead of the minute numbers
With Gantt1
	.BeginUpdate
	.Chart.FirstVisibleDate = #2/5/2008#
	.Chart.LevelCount = 3
	.Chart.Level(0).Label = "<b><%mmm%> <%dd%></b> <%yyyy%> "
	With .Chart.Level(1)
		.Label = "<%hh%>"
		.Alignment = CenterAlignment
	End With
	With .Chart.Level(2)
		.Label = ""
		.Unit = exMinute
		.Count = 15
	End With
	.Chart.UnitWidth = 6
	.EndUpdate
End With
|
|
597
|
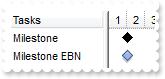
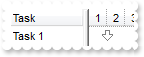
How can I change the visual appearance of the milestone bar using EBN
With Gantt1
	With .VisualAppearance
		.Add 1,"gBFLBCJwBAEHhEJAEGg4BKMMQAAYAQGKIYBkAKBQAGaAoDDMMILQiMQwjRBMKgBBCLIxiGK4DhiF4aRTHUKAAKQahLEaSZLhEZRQiqA4sS5FQBSBDQFwSByEY6mSaYJ" & _
	"AWK4tCyNM7SfQAbxnAgYaLAAYRUjuHZOTZAc4UfAdFL/K4AKrfeZIeAiCRQGiYZyHKaRShjDwXKLIIjbJhkNoJChCNQgBScPgxCx8JypaCaar2fjQM6zWAMdb2Cz7PjD" & _
	"H7wPA1WYJRaDYjhcB4LheAqGXBWUYLYb8XS3EKJYhiWA4HjqFjGJpcEzPbRiNx3H6SABlLLaLo7JpGO52FrTHZjXyzLqBVpoOyEbrmcozYzjN41RpWETfQYDcwteqcLp" & _
	"rhGVZrm6dp8j4bAnDQP5Uh+OpcH6R4Lg2YJvEIeg6kWEoJB2ZZyG6GoLCSXxtG+IZ1GmfhJjcawNFWfB/h+V5pnUc5VhWeZ4BMX4jlySwtiAJodlEYRaBYFgHHgIA2gG" & _
	"ExkFUdxFl6A5hgUbgXgcVRzFiXA3CICARAEgI"
		.Add 2,"CP:1 -6 0 5 0"
	End With
	With .Chart
		.FirstVisibleDate = #1/1/2001#
		With .Bars.Add("MilestoneEBN")
			.Color = &H2000000
			.Height = 14
		End With
	End With
	.Columns.Add "Tasks"
	With .Items
		.AddBar .AddItem("Milestone"),"Milestone",#1/2/2001#,#1/2/2001 0:00:01 AM#
		.AddBar .AddItem("Milestone EBN "),"MilestoneEBN",#1/2/2001#,#1/2/2001 0:00:01 AM#
	End With
End With
|
|
596
|
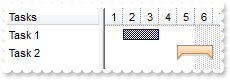
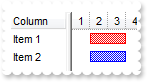
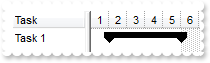
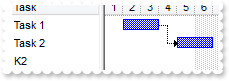
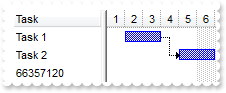
How can I change the visual appearance of the summary bar using EBN
With Gantt1
	.VisualAppearance.Add 1,"gBFLBCJwBAEHhEJAEGg4BGICg6AADACAxRDAMgBQKAAzQFAYZhhBaERiGEaIJhUAIIRZGMQxXAcMQvDSKQJhGDAADEMgyAJCIxjPIgZBoGqPBpASQJUhkMocR7HMygB" & _
	"IkSRNA8kMwxdQEaw9ECRIDpGaYWTFDhsABTVQRLL0Tw9ISERqoSSaGgkCYaA7CNJ0PBNJSjJ6LJZGURbKqyCQ1DBbUB3BaUaQ9JaKa7pKa7cpWKIqSxEMrxcLFcT5DSb" & _
	"YDxGjLEhmPZBVZQNBxtJbFQHWJCNgzVAdOAAfzQM70GpMQoWJYeVpEObSBD1dABTCBczADYoex7ID+aJuGiYVZdWxJOjfbhkTTIJAaCawABrWxR8iHN5paTnUpzDjwbg" & _
	"0kqRRyr+XwjA8Go/HSBp6g6KJTFcGpWmYdg8H6dJTH0EZelueBfBuLwyBMd50nIfR+kmXB4BECQUAaEYMHQHRHCGFRYI2ZAwEIExghQZA2EIQoGGoEhOgGBBYlAeYYHM" & _
	"WJcDcGx4HYHoHmICIFjeBohkaDAAC2DAjBYJIIiKSI2CSC5hjQJBsCOCwYiIKoGmKWJkn6DANkiWgzCwYwolAcQkksWJaCuDohlicg2hDQR+EELBInKcJohMJBomILoG" & _
	"mISQuESFBOgkOQDg+SoTEyfoXCUSImDyGZhjkaI1hcJgTnoXgACYCYKG2GQkEkVJchKIoZDIbIciYKY+HEP4mlmThSg+aBIlKBYUCUKgGHyG4jEkPoKiAKI6D6EokGkS" & _
	"gyECF5jEKVJZD+aYqHKG4nGoCh+iKJ4qEqBokh+KYag6JoqmqKo2iWJpqgKRJHDiT5qk6NYtCsapmjiLprHqdo6i8awan6QovCwOp6kSLQsBsHpGjKbBbBaMYhm0Cgal" & _
	"ILBtBsUpTiGUIUAQgIA=="
	With .Chart
		.FirstVisibleDate = #1/1/2001#
		With .Bars.Copy("Task","Summary")
			.Color = &H1000000
			.Height = 16
		End With
	End With
	.Columns.Add "Tasks"
	With .Items
		.AddBar .AddItem("Task 1"),"Task",#1/2/2001#,#1/4/2001#
		.AddBar .AddItem("Task 2"),"Summary",#1/5/2001#,#1/7/2001#
	End With
End With
|
|
595
|
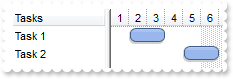
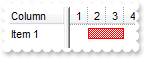
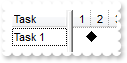
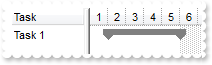
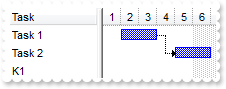
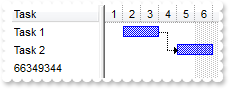
How can I change the visual appearance of the task bar using EBN
With Gantt1
	.VisualAppearance.Add 1,"gBFLBCJwBAEHhEJAEGg4BGoCg6AADACAxRDAMgBQKAAzQFAYZhhBaERiGEaIJhUAIIRZGMQxXAcMQvDSKQJhGLhQiSJoJDSBEgSXDIZQ5D6OZYACDJQACJYJTbAYzyP" & _
	"JkPRAA6EZCmGAwCglf5HABRb7xNLkbQ8GySKJnWCQJhoD5BSLCNRUTRFFQtGgZBpEWwLCjQNQwWLKFoTJIEPSBDKqYDoKYqTgOOZOThHQz3HakQRdAa/ZpnaKpUo2d47" & _
	"XjMWBwGA0EzeAAGaxoShqdoiFaGU7UOJVJBOGwHK6BchoMAKbp6XoVWRaOAWLZWVABM7XLZxbLccyGfZ1XhdV5UbqUMznR7PNrjLKIJpCOJbbyAFwgBaeQABYLhK7iHR" & _
	"mi8XYwjMWpjFWOx1GIB5LmgdB4HCEBECSIBpDGHQOicIwokYPImikEIJj6eJIloEgogSc40FGcJEFiYZIG2VIoAURw1g2QxyAQNwNAMPJOgIYI4CoDIBmAeAKBIUpQDU" & _
	"KJYDoTpIB4vxgmgdgNgeYZDDoFw7CEJhQn+BohmKfImCWSZRlgYwikYMQ0gwF4DniTA/gwBJYjQYwsgoIg6AyCRQDiIJODAZBImoOguAmMZ4lQLIJjOMI3CYZJpEIT4K" & _
	"iKSI6DqD5ZGAAgHC2DAjBYR4SGUGYGE+GIlCmFhRhIB5iFAbwWsiJgMhoCoxngV4ZCcSYOHaGYnHmIg8COJpoCoOISmSWZeHWHgoEkRoAg4EIYB4NogmiSgKg6GRjGoJ" & _
	"gFh+ZJKDaBYjmgaQygiBRUHmbhoDsTAyiqIIoioGoOw8aoKhKKoemeOIaAeF5HmqHoqiyKxKgYaN/locgBiuZRojoVIok8cwsjaMBLGqDoAhGIpoEYWYEmAIxUkQLZmg" & _
	"iYg2g2I4JiCQwuAqWIOIkEAQICA=="
	With .Chart
		.FirstVisibleDate = #1/1/2001#
		With .Bars.Item("Task")
			.Color = &H1000000
			.Height = 16
		End With
	End With
	.Columns.Add "Tasks"
	With .Items
		.AddBar .AddItem("Task 1"),"Task",#1/2/2001#,#1/4/2001#
		.AddBar .AddItem("Task 2"),"Task",#1/5/2001#,#1/7/2001#
	End With
End With
|
|
594
|
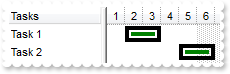
How can I change the visual appearance of the task bar using EBN
With Gantt1
	.VisualAppearance.Add 1,"gBFLBCJwBAEHhEJAEGg4BZsIQAAYAQGKIYBkAKBQAGaAoDDMMILQiMQwjRBMKgBBCLIxiGK4DhiGoZATCMbDBIcSwSGgCJCjeS4ZDKHIXSxFUKTBAcSQTGyBRokaYZR" & _
	"i6A4+TRPETTWAEcABHSbQCoKTKAoCHpLQLMYxDKItJSpGYaRgqWCaZpuUIaUzKVbxbK9CSMGiQbIsOJrBqqQozWZHVITLR9VgBNqga7uGR5DoqdovU5dVTVda9Ly5LSs" & _
	"MQvfALCqOe45URdNp3RiVBYfI6+cZvfJLWh4NqeAbCMC1UJoYhlUKCBg0TRoVo9AIDX5QWaYXC0AkBA=="
	With .Chart
		.FirstVisibleDate = #1/1/2001#
		With .Bars.Item("Task")
			.Color = &H1000000
			.Height = 16
		End With
	End With
	.Columns.Add "Tasks"
	With .Items
		.AddBar .AddItem("Task 1"),"Task",#1/2/2001#,#1/4/2001#
		.AddBar .AddItem("Task 2"),"Task",#1/5/2001#,#1/7/2001#
	End With
End With
|
|
593
|
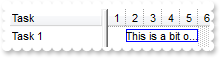
How can I clip the HTML text or caption inside the bar
With Gantt1
	.Columns.Add "Task"
	.Chart.FirstVisibleDate = #1/1/2001#
	With .Chart.Bars.Item("Task")
		.Pattern = exPatternBox
		.Height = 13
	End With
	With .Items
		h = .AddItem("Task 1")
		.AddBar h,"Task",#1/2/2001#,#1/6/2001#,"K1","This is a bit of text that get's clipped"
		.ItemBar(h,"K1",exBarHAlignCaption) = 3
	End With
End With
|
|
592
|
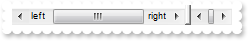
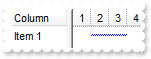
How can I align the text/caption on the scroll bar
With Gantt1
	.ScrollPartCaption(exHScroll,exLowerBackPart) = "left"
	.ScrollPartCaptionAlignment(exHScroll,exLowerBackPart) = LeftAlignment
	.ScrollPartCaption(exHScroll,exUpperBackPart) = "right"
	.ScrollPartCaptionAlignment(exHScroll,exUpperBackPart) = RightAlignment
	.ColumnAutoResize = False
	.Columns.Add 1
	.Columns.Add 2
	.Columns.Add 3
	.Columns.Add 4
End With
|
|
591
|
How do I programmatically control the position of the horizontal scroll bar in the chart area, so I can specify a range of dates to scorll within
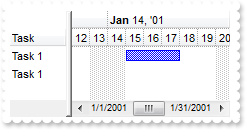
With Gantt1
	.BeginUpdate
	.Columns.Add "Task"
	With .Chart
		.LevelCount = 2
		.PaneWidth(0) = 56
		.ScrollRange(exStartDate) = #1/1/2001#
		.ScrollRange(exEndDate) = #1/31/2001#
		.FirstVisibleDate = #1/12/2001#
	End With
	.ScrollPartCaption(exHChartScroll,exLowerBackPart) = .Chart.ScrollRange(exStartDate)
	.ScrollPartCaptionAlignment(exHChartScroll,exLowerBackPart) = LeftAlignment
	.ScrollPartCaption(exHChartScroll,exUpperBackPart) = .Chart.ScrollRange(exEndDate)
	.ScrollPartCaptionAlignment(exHChartScroll,exUpperBackPart) = RightAlignment
	With .Items
		h = .AddItem("Task 1")
		.AddBar h,"Task",#1/15/2001#,#1/18/2001#,"K1"
		h = .AddItem("Task 1")
		.AddBar h,"Task",#1/5/2001#,#1/11/2001#,"K1"
	End With
	.EndUpdate
End With
|
|
590
|
How can I programmatically control the position of the "splitter" between the item list on the left side and the gantt chart on the right
With Gantt1
	.Chart.PaneWidth(True) = 196
End With
|
|
589
|
How can I add a milestone bar and some text in the chart area
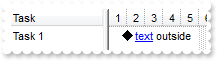
With Gantt1
	.Columns.Add "Task"
	.Chart.FirstVisibleDate = #1/1/2001#
	With .Items
		h = .AddItem("Task 1")
		.AddBar h,"Milestone",#1/2/2001#,#1/2/2001#,,"<a1>text</a> outside"
		.ItemBar(h,,exBarHAlignCaption) = 18
	End With
End With
|
|
588
|
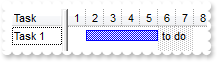
How can I display or align the bar's caption or text outside of the bar
With Gantt1
	.Columns.Add "Task"
	.Chart.FirstVisibleDate = #1/1/2001#
	.DefaultItemHeight = 32
	With .Items
		h = .AddItem("Task 1")
		.AddBar h,"Task",#1/3/2001#,#1/5/2001#,"K1"
		.ItemBar(h,"K1",exBarCaption) = "<b>to do</b>"
		.ItemBar(h,"K1",exBarHAlignCaption) = 18
		.ItemBar(h,"K1",exBarVAlignCaption) = 16
	End With
End With
|
|
587
|
How can I display or align the bar's caption or text outside of the bar
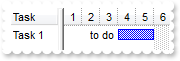
With Gantt1
	.Columns.Add "Task"
	.Chart.FirstVisibleDate = #1/1/2001#
	With .Items
		h = .AddItem("Task 1")
		.AddBar h,"Task",#1/4/2001#,#1/6/2001#,"K1"
		.ItemBar(h,"K1",exBarCaption) = "to do"
		.ItemBar(h,"K1",exBarHAlignCaption) = 16
	End With
End With
|
|
586
|
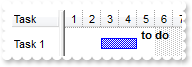
How can I display or align the bar's caption or text outside of the bar
With Gantt1
	.Columns.Add "Task"
	.Chart.FirstVisibleDate = #1/1/2001#
	With .Items
		h = .AddItem("Task 1")
		.AddBar h,"Task",#1/2/2001#,#1/6/2001#,"K1"
		.ItemBar(h,"K1",exBarCaption) = "to do "
		.ItemBar(h,"K1",exBarHAlignCaption) = 18
	End With
End With
|
|
585
|
Is there any option to count the non-working days
With Gantt1
	.BeginUpdate
	.Chart.FirstVisibleDate = #1/1/2002#
	.Columns.Add "Task"
	With .Items
		h = .AddItem("Task 1")
		.AddBar h,"Task",#1/2/2002#,#1/4/2002#,"A"
		var_ItemBar = .ItemBar(h,"A",exBarNonWorkingCount)
	End With
	.EndUpdate
End With
|
|
584
|
Is there any option to count or to specify the working days
With Gantt1
	.BeginUpdate
	.Chart.FirstVisibleDate = #1/1/2002#
	.Columns.Add "Task"
	With .Items
		h = .AddItem("Task 1")
		.AddBar h,"Task",#1/2/2002#,#1/4/2002#,"A"
		var_ItemBar = .ItemBar(h,"A",exBarWorkingCount)
	End With
	.EndUpdate
End With
|
|
583
|
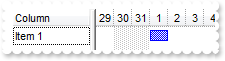
How do I select the next row/item
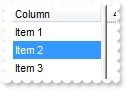
With Gantt1
	.Columns.Add "Column"
	With .Items
		.AddItem "Item 1"
		.AddItem "Item 2"
		.AddItem "Item 3"
		.SelectItem(.NextVisibleItem(.FocusItem)) = True
	End With
End With
|
|
582
|
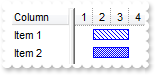
How do I define the visual appearance of the bar by using your EBN/skin files
With Gantt1
	.VisualAppearance.Add 1,"c:\exontrol\images\normal.ebn"
	.Chart.Bars.Copy("Task","EBN").Color = &H1000000
	.Chart.FirstVisibleDate = #1/1/2001#
	.Columns.Add "Column"
	With .Items
		.AddBar .AddItem("Item 1"),"EBN",#1/2/2001#,#1/4/2001#
		.AddBar .AddItem("Item 2"),"Task",#1/2/2001#,#1/4/2001#
	End With
End With
|
|
581
|
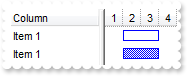
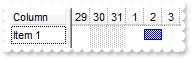
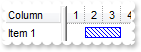
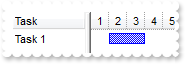
Is it possible to have an "empty box" pattern for the bars
With Gantt1
	.Chart.Bars.Copy("Task","Box").Pattern = exPatternBox
	.Chart.FirstVisibleDate = #1/1/2001#
	.Columns.Add "Column"
	With .Items
		.AddBar .AddItem("Item 1"),"Box",#1/2/2001#,#1/4/2001#
		.AddBar .AddItem("Item 1"),"Task",#1/2/2001#,#1/4/2001#
	End With
End With
|
|
580
|
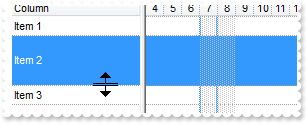
How do I enable resizing ( changing the height ) the items at runtime
With Gantt1
	.ItemsAllowSizing = exResizeItem
	.DrawGridLines = exHLines
	.ScrollBySingleLine = True
	.Columns.Add "Column"
	.Items.AddItem "Item 1"
	With .Items
		.ItemHeight(.AddItem("Item 2")) = 48
	End With
	.Items.AddItem "Item 3"
End With
|
|
579
|
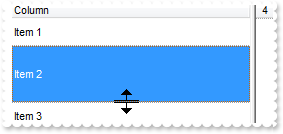
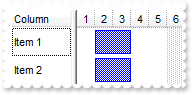
How do I enable resizing all the items at runtime
With Gantt1
	.ItemsAllowSizing = exResizeAllItems
	.DrawGridLines = exHLines
	.Columns.Add "Column"
	.Items.AddItem "Item 1"
	With .Items
		.ItemHeight(.AddItem("Item 2")) = 48
	End With
	.Items.AddItem "Item 3"
End With
|
|
578
|
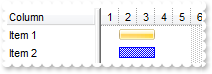
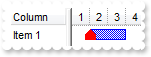
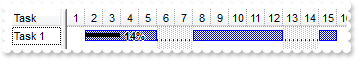
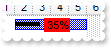
I'm trying to use the percentage display in my gantt's bars. Unfortunately, I don't see any percentage on the gantt chart
With Gantt1
	.Columns.Add "Task"
	.Chart.FirstVisibleDate = #1/1/2001#
	With .Chart.Bars.Copy("Task","BarName")
		.Color = RGB(255,0,0)
		.Pattern = exPatternBDiagonal
	End With
	.Chart.Bars.Add("BarName%Progress").Shortcut = "Percent"
	With .Items
		h = .AddItem("Task 1")
		.AddBar h,"Percent",#1/2/2001#,#1/6/2001#,"K1"
		.ItemBar(h,"K1",exBarPercent) = 0.4
		.ItemBar(h,"K1",exBarShowPercentCaption) = True
	End With
End With
|
|
577
|
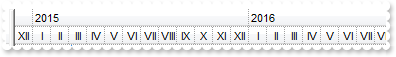
How I can show Months in Time Unit panel into Roman numerals
With Gantt1
	.Chart.LevelCount = 2
	.Chart.Level(0).Label = 0
	With .Chart.Level(1)
		.Label = "<%mr%>"
		.Unit = exMonth
	End With
End With
|
|
576
|
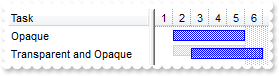
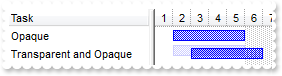
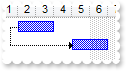
Can I show a bar with a different vertical position
With Gantt1
	.Columns.Add "Task"
	.Chart.FirstVisibleDate = #1/1/2001#
	With .Items
		h = .AddItem("Opaque")
		.AddBar h,"Task",#1/2/2001#,#1/6/2001#,"K1"
		h = .AddItem("Transparent and Opaque")
		.AddBar h,"Task",#1/2/2001#,#1/6/2001#,"K1"
		.ItemBar(h,"K1",exBarOffset) = "-3"
		.ItemBar(h,"K1",exBarTransparent) = 80
		.AddBar h,"Task",#1/3/2001#,#1/7/2001#,"K2"
	End With
End With
|
|
575
|
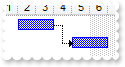
How can I show transparent and opaque bars in the same chart
With Gantt1
	.Columns.Add "Task"
	.Chart.FirstVisibleDate = #1/1/2001#
	With .Items
		h = .AddItem("Opaque")
		.AddBar h,"Task",#1/2/2001#,#1/6/2001#,"K1"
		h = .AddItem("Transparent and Opaque")
		.AddBar h,"Task",#1/2/2001#,#1/6/2001#,"K1"
		.ItemBar(h,"K1",exBarOffset) = "-3"
		.ItemBar(h,"K1",exBarTransparent) = 80
		.AddBar h,"Task",#1/3/2001#,#1/7/2001#,"K2"
	End With
End With
|
|
574
|
How can I draw bars using transparent colors
With Gantt1
.Chart.ShowTransparentBars = 60
.Chart.FirstVisibleDate = #1/1/2001#
.Chart.Bars.Copy("Task","TaskR").Color = RGB(255,0,0)
.Chart.PaneWidth(0) = 48
.Columns.Add "Column"
With .Items
h = .AddItem("Item 1")
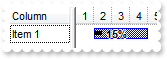
.AddBar h,"Task",#1/2/2001#,#1/5/2001#,"A"
.AddBar h,"TaskR",#1/4/2001#,#1/7/2001#,"B"
End With
End With
|
|
573
|
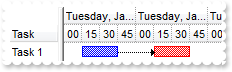
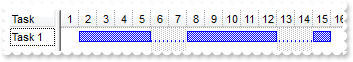
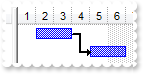
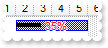
Can I change the Task bar so it display a Progress or a Percent bar, but it is splitted when the task intersect a non working area
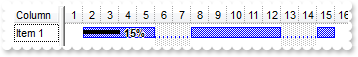
With Gantt1
With .Chart
.FirstVisibleDate = #1/1/2001#
.Bars.Add("Task%Progress:Split").Shortcut = "Task"
End With
.Columns.Add "Column"
With .Items
h = .AddItem("Item 1")
.AddBar h,"Task",#1/2/2001#,#1/16/2001#,"K1"
.ItemBar(h,"K1",exBarPercent) = 0.15
.ItemBar(h,"K1",exBarShowPercentCaption) = True
End With
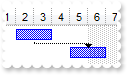
End With
|
|
572
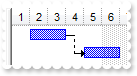
|
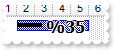
Can I change the Task bar so it display a Progress or a Percent bar
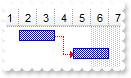
With Gantt1
	With .Chart
		.FirstVisibleDate = #1/1/2001#
		.Bars.Add("Task%Progress").Shortcut = "Task"
	End With
	.Columns.Add "Column"
	With .Items
		h = .AddItem("Item 1")
		.AddBar h,"Task",#1/2/2001#,#1/5/2001#,"K1"
		.ItemBar(h,"K1",exBarPercent) = 0.15
		.ItemBar(h,"K1",exBarShowPercentCaption) = True
	End With
End With
|
|
571
|
How can I remove the filter
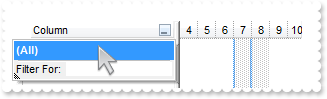
With Gantt1
	With .Columns.Add("Column")
		.DisplayFilterButton = True
		.FilterType = exBlanks
	End With
	.ApplyFilter
	.ClearFilter
End With
|
|
570
|
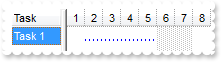
I use the ShowEmptyBars property, but I display seconds from 15 to 15, and the bars are not shown correctly. What can I do
With Gantt1
.BeginUpdate
With .Chart
.FirstVisibleDate = #1/1/2002#
.LevelCount = 2
.Level(0).Label = 1048576
With .Level(1)
.Label = "<%ss%>"
.Count = 15
End With
.ShowEmptyBars = 15
.ShowEmptyBarsUnit = exSecond
.PaneWidth(0) = 48
End With
.Columns.Add "Task"
With .Items
h = .AddItem("Task 1")
.AddBar h,"Task",#1/1/2002 0:00:15 AM#,#1/1/2002 0:00:15 AM#,"A"
.AddBar h,"Task",#1/1/2002 0:01:15 AM#,#1/1/2002 0:01:30 AM#,"B"
.AddLink "AB",h,"A",h,"B"
End With
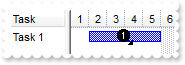
.EndUpdate
End With
|
|
569
|
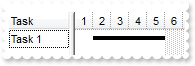
I need the bar works like in the MS Project, where task from 1/1/2001 to 1/1/2001 must display 1 day
With Gantt1
	.Chart.FirstVisibleDate = #1/1/2001#
	.Chart.ShowEmptyBars = 1
	.Columns.Add "Column"
	With .Items
		.AddBar .AddItem("Item 1"),"Task",#1/1/2001#,#1/1/2001#
	End With
End With
|
|
568
|
I have a bar that has the start and end date identical. Nothing is displayed. What can I do
With Gantt1
	.Chart.FirstVisibleDate = #1/1/2001#
	.Chart.ShowEmptyBars = 1
	.Columns.Add "Column"
	With .Items
		.AddBar .AddItem("Item 1"),"Task",#1/2/2001#,#1/2/2001#
	End With
End With
|
|
567
|
How can I display seconds and bars for 15 to 15
With Gantt1
	.BeginUpdate
	.Chart.FirstVisibleDate = "1/1/2002 00:00"
	.Chart.LevelCount = 2
	.Chart.Level(0).Label = 1048576
	With .Chart.Level(1)
		.Label = "<%ss%>"
		.Count = 15
	End With
	.Chart.PaneWidth(0) = 48
	.Chart.Bars.Copy("Task","Task2").Color = RGB(255,0,0)
	.Columns.Add "Task"
	With .Items
		h = .AddItem("Task 1")
		.AddBar h,"Task","1/1/2002 00:00:15","1/1/2002 00:00:45","A"
		.AddBar h,"Task2","1/1/2002 00:01:15","1/1/2002 00:01:45","B"
		.AddLink "AB",h,"A",h,"B"
	End With
	.EndUpdate
End With
|
|
566
|
How can I copy a predefined bar
With Gantt1
	.Chart.Bars.Copy("Task","T2").Color = RGB(255,0,0)
	.Chart.FirstVisibleDate = #1/1/2001#
	.Columns.Add "Column"
	With .Items
		.AddBar .AddItem("Item 1"),"T2",#1/2/2001#,#1/4/2001#
	End With
End With
|
|
565
|
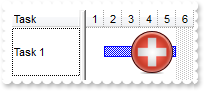
How can I define my own custom bar, using my icons or pictures
With Gantt1
	.Images "gBJJgBAIDAAGAAEAAQhYAf8Pf4hh0QihCJo2AEZjQAjEZFEaIEaEEaAIAkcbk0olUrlktl0vmExmUzmk1m03nE5nU7nk9n0/oFBoVDolFo1HpFJpVLplNp1PqFRqVTq" & _
	"lVq1XrFZrVbrldr1fsFhsVjslls1ntFptVrtltt1vuFxuVzul1u13vF5vV7vl9v1/wGBwWDwmFw2HxGJxWLxmNx0xiFdyOTh8Tf9ZymXx+QytcyNgz8r0OblWjyWds+m" & _
	"0ka1Vf1ta1+r1mos2xrG2xeZ0+a0W0qOx3GO4NV3WeyvD2XJ5XL5nN51aiw+lfSj0gkUkAEllHanHI5j/cHg8EZf7w8vl8j4f/qfEZeB09/vjLAB30+kZQAP/P5/H6/y" & _
	"NAOAEAwCjMBwFAEDwJBMDwLBYAP2/8Hv8/gAGAD8LQs9w/nhDY/oygIA="
	With .Chart.Bars
		.AddShapeCorner 12345,1
		.AddShapeCorner 22345,2
		With .Add("T2")
			.StartShape = &H5740 Or ShapeCornerEnum.exShapeIconCircleUp1
			.EndShape = &H3020 Or ShapeCornerEnum.exShapeIconVBar Or ShapeCornerEnum.exShapeIconRight
			.EndColor = RGB(255,0,0)
			.Pattern = exPatternDot
			.Color = RGB(255,0,255)
			.Shape = exShapeThinCenter
		End With
	End With
	.Chart.FirstVisibleDate = #1/1/2001#
	.Columns.Add "Column"
	With .Items
		.AddBar .AddItem("Item 1"),"T2",#1/2/2001#,#1/4/2001#
	End With
End With
|
|
564
|
How can I access a predefined bar
With Gantt1
	.Chart.FirstVisibleDate = #1/1/2001#
	.Columns.Add "Column"
	With .Items
		.AddBar .AddItem("Item 1"),"Task",#1/2/2001#,#1/4/2001#
	End With
	.Chart.Bars.Item("Task").Color = RGB(255,0,0)
End With
|
|
563
|
How can I access a predefined bar
With Gantt1
	.Chart.FirstVisibleDate = #1/1/2001#
	.Columns.Add "Column"
	With .Items
		.AddBar .AddItem("Item 1"),"Task",#1/2/2001#,#1/4/2001#
	End With
	.Chart.Bars.Item("Task").Color = RGB(255,0,0)
End With
|
|
562
|
How can I remove all predefined bars
With Gantt1
	.Chart.FirstVisibleDate = #1/1/2001#
	.Columns.Add "Column"
	With .Items
		.AddBar .AddItem("Item 1"),"Task",#1/2/2001#,#1/4/2001#
	End With
End With
|
|
561
|
How can I remove a predefined bar
With Gantt1
	.Chart.FirstVisibleDate = #1/1/2001#
	.Columns.Add "Column"
	With .Items
		.AddBar .AddItem("Item 1"),"Task",#1/2/2001#,#1/4/2001#
	End With
End With
|
|
560
|
How do I get the number of predefined bars
With Gantt1
	.Columns.Add Gantt1.Chart.Bars.Count
End With
|
|
559
|
How can I change the height of the task bar
With Gantt1
	With .Chart.Bars.Copy("Task","T2")
		.Height = 24
		.EndShape = exShapeIconDown1
		.EndColor = RGB(255,0,0)
	End With
	.Chart.FirstVisibleDate = #1/1/2001#
	.Columns.Add "Column"
	With .Items
		h = .AddItem("Item 1")
		.ItemHeight(h) = 28
		.AddBar h,"T2",#1/2/2001#,#1/4/2001#
		.AddBar .AddItem("Item 2"),"Task",#1/2/2001#,#1/4/2001#
	End With
End With
|
|
558
|
How can I change the ending shape for all task bars
With Gantt1
	With .Chart.Bars.Item("Task")
		.EndShape = exShapeIconUp1
		.EndColor = RGB(255,0,0)
	End With
	.Chart.FirstVisibleDate = #1/1/2001#
	.Columns.Add "Column"
	With .Items
		.AddBar .AddItem("Item 1"),"Task",#1/2/2001#,#1/4/2001#
	End With
End With
|
|
557
|
How can I change the height of the task bar
With Gantt1
	.DefaultItemHeight = 28
	.Chart.Bars.Item("Task").Height = 24
	.Chart.FirstVisibleDate = #1/1/2001#
	.Columns.Add "Column"
	With .Items
		.AddBar .AddItem("Item 1"),"Task",#1/2/2001#,#1/4/2001#
		.AddBar .AddItem("Item 2"),"Task",#1/2/2001#,#1/4/2001#
	End With
End With
|
|
556
|
How can I change the starting shape for all task bars
With Gantt1
	With .Chart.Bars.Item("Task")
		.StartShape = exShapeIconUp1
		.StartColor = RGB(255,0,0)
	End With
	.Chart.FirstVisibleDate = #1/1/2001#
	.Columns.Add "Column"
	With .Items
		.AddBar .AddItem("Item 1"),"Task",#1/2/2001#,#1/4/2001#
	End With
End With
|
|
555
|
How can I change the height of the task bar
With Gantt1
	.Chart.Bars.Copy("Task","T2").Height = 17
	.Chart.FirstVisibleDate = #1/1/2001#
	.Columns.Add "Column"
	With .Items
		.AddBar .AddItem("Item 1"),"T2",#1/2/2001#,#1/4/2001#
		.AddBar .AddItem("Item 2"),"Task",#1/2/2001#,#1/4/2001#
	End With
End With
|
|
554
|
How can I change the height for all task bars
With Gantt1
	.Chart.Bars.Item("Task").Height = 17
	.Chart.FirstVisibleDate = #1/1/2001#
	.Columns.Add "Column"
	With .Items
		.AddBar .AddItem("Item 1"),"Task",#1/2/2001#,#1/4/2001#
	End With
End With
|
|
553
|
How can I change the color of the task bar
With Gantt1
	.Chart.Bars.Copy("Task","T2").Color = RGB(255,0,0)
	.Chart.FirstVisibleDate = #1/1/2001#
	.Columns.Add "Column"
	With .Items
		.AddBar .AddItem("Item 1"),"T2",#1/2/2001#,#1/4/2001#
		.AddBar .AddItem("Item 2"),"Task",#1/2/2001#,#1/4/2001#
	End With
End With
|
|
552
|
How can I change the color for all task bars
With Gantt1
	.Chart.Bars.Item("Task").Color = RGB(255,0,0)
	.Chart.FirstVisibleDate = #1/1/2001#
	.Columns.Add "Column"
	With .Items
		.AddBar .AddItem("Item 1"),"Task",#1/2/2001#,#1/4/2001#
	End With
End With
|
|
551
|
How can I change the shape for all task bars
With Gantt1
	.Chart.Bars.Item("Task").Shape = exShapeSolidDown
	.Chart.FirstVisibleDate = #1/1/2001#
	.Columns.Add "Column"
	With .Items
		.AddBar .AddItem("Item 1"),"Task",#1/2/2001#,#1/4/2001#
	End With
End With
|
|
550
|
How can I change the shape of the task bar
With Gantt1
	.Chart.Bars.Copy("Task","T2").Shape = exShapeThinCenter
	.Chart.FirstVisibleDate = #1/1/2001#
	.Columns.Add "Column"
	With .Items
		.AddBar .AddItem("Item 1"),"T2",#1/2/2001#,#1/4/2001#
	End With
End With
|
|
549
|
How can I change the pattern or style for all task bars
With Gantt1
	.Chart.Bars.Item("Task").Pattern = exPatternFDiagonal
	.Chart.FirstVisibleDate = #1/1/2001#
	.Columns.Add "Column"
	With .Items
		.AddBar .AddItem("Item 1"),"Task",#1/2/2001#,#1/4/2001#
	End With
End With
|
|
548
|
How can I change the pattern of the task bar
With Gantt1
	.Chart.Bars.Copy("Task","T2").Pattern = exPatternFDiagonal
	.Chart.FirstVisibleDate = #1/1/2001#
	.Columns.Add "Column"
	With .Items
		.AddBar .AddItem("Item 1"),"T2",#1/2/2001#,#1/4/2001#
		.AddBar .AddItem("Item 2"),"Task",#1/2/2001#,#1/4/2001#
	End With
End With
|
|
547
|
How can I add a percent bar in the chart area, so the task bar is splited for non working days or hours
With Gantt1
	.Columns.Add "Task"
	.Chart.Bars.Add("Task%Progress:Split").Shortcut = "TS"
	.Chart.FirstVisibleDate = #1/1/2001#
	With .Items
		h = .AddItem("Task 1")
		.AddBar h,"TS",#1/2/2001#,#1/16/2001#,"P1"
		.ItemBar(h,"P1",exBarPercent) = 0.14
		.ItemBar(h,"P1",exBarShowPercentCaption) = True
	End With
End With
|
|
546
|
How can I add a bar in the chart area, so the task bar is splited for non working days or hours
With Gantt1
	.Columns.Add "Task"
	.Chart.Bars.Add("Task:Split").Shortcut = "TS"
	.Chart.FirstVisibleDate = #1/1/2001#
	With .Items
		.AddBar .AddItem("Task 1"),"TS",#1/2/2001#,#1/16/2001#
	End With
End With
|
|
545
|
How can I add a split bar in the chart area
With Gantt1
	.Columns.Add "Task"
	.Chart.FirstVisibleDate = #1/1/2001#
	With .Items
		.AddBar .AddItem("Task 1"),"Split",#1/2/2001#,#1/6/2001#
	End With
End With
|
|
544
|
How can I add a progress bar in the chart area
With Gantt1
	.Columns.Add "Task"
	.Chart.FirstVisibleDate = #1/1/2001#
	With .Items
		.AddBar .AddItem("Task 1"),"Progress",#1/2/2001#,#1/6/2001#
	End With
End With
|
|
543
|
How can I add a milestone bar in the chart area
With Gantt1
	.Columns.Add "Task"
	.Chart.FirstVisibleDate = #1/1/2001#
	With .Items
		.AddBar .AddItem("Task 1"),"Milestone",#1/2/2001#,#1/2/2001#
	End With
End With
|
|
542
|
How can I add a summary bar in the chart area
With Gantt1
	.Columns.Add "Task"
	.Chart.FirstVisibleDate = #1/1/2001#
	With .Items
		.AddBar .AddItem("Task 1"),"Summary",#1/2/2001#,#1/6/2001#
	End With
End With
|
|
541
|
How can I add a project summary bar in the chart area
With Gantt1
	.Columns.Add "Task"
	.Chart.FirstVisibleDate = #1/1/2001#
	With .Items
		.AddBar .AddItem("Task 1"),"Project Summary",#1/2/2001#,#1/6/2001#
	End With
End With
|
|
540
|
How can I add a deadline bar in the chart area
With Gantt1
	.Columns.Add "Task"
	.Chart.FirstVisibleDate = #1/1/2001#
	With .Items
		.AddBar .AddItem("Task 1"),"Deadline",#1/2/2001#,#1/2/2001#
	End With
End With
|
|
539
|
How can I add a task bar in the chart area
With Gantt1
	.Columns.Add "Task"
	.Chart.FirstVisibleDate = #1/1/2001#
	With .Items
		.AddBar .AddItem("Task 1"),"Task",#1/2/2001#,#1/4/2001#
	End With
End With
|
|
538
|
How can I assign a picture or an icon to a bar in the chart
With Gantt1
	.HTMLPicture("p1") = "c:\exontrol\images\zipdisk.gif"
	.Columns.Add "Task"
	.Chart.FirstVisibleDate = #1/1/2001#
	With .Items
		h = .AddItem("Task 1")
		.ItemHeight(h) = 48
		.AddBar h,"Task",#1/2/2001#,#1/6/2001#,"K1"
		.ItemBar(h,"K1",exBarCaption) = "<img>p1</img>"
		.ItemBar(h,"K1",exBarHAlignCaption) = 2
	End With
End With
|
|
537
|
How can I assign a picture or an icon to a bar in the chart
With Gantt1
	.Images "gBJJgBAIDAAGAAEAAQhYAf8Pf4hh0QihCJo2AEZjQAjEZFEaIEaEEaAIAkcbk0olUrlktl0vmExmUzmk1m03nE5nU7nk9n0/oFBoVDolFo1HpFJpVLplNp1PqFRqVTq" & _
	"lVq1XrFZrVbrldr1fsFhsVjslls1ntFptVrtltt1vuFxuVzul1u13vF5vV7vl9v1/wGBwWDwmFw2HxGJxWLxmNx0xiFdyOTh8Tf9ZymXx+QytcyNgz8r0OblWjyWds+m" & _
	"0ka1Vf1ta1+r1mos2xrG2xeZ0+a0W0qOx3GO4NV3WeyvD2XJ5XL5nN51aiw+lfSj0gkUkAEllHanHI5j/cHg8EZf7w8vl8j4f/qfEZeB09/vjLAB30+kZQAP/P5/H6/y" & _
	"NAOAEAwCjMBwFAEDwJBMDwLBYAP2/8Hv8/gAGAD8LQs9w/nhDY/oygIA="
	.Columns.Add "Task"
	.Chart.FirstVisibleDate = #1/1/2001#
	With .Items
		h = .AddItem("Task 1")
		.AddBar h,"Task",#1/2/2001#,#1/6/2001#,"K1"
		.ItemBar(h,"K1",exBarCaption) = "<img>1</img>"
	End With
End With
|
|
536
|
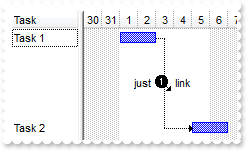
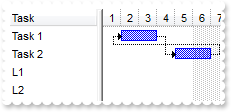
How can I display or add an anchor or a hyperlink in the link
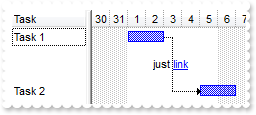
With Gantt1
	.Columns.Add "Task"
	.Chart.FirstVisibleDate = #1/1/2001#
	With .Items
		h1 = .AddItem("Task 1")
		.AddBar h1,"Task",#1/1/2001#,#1/3/2001#,"K1"
		.AddItem ""
		.AddItem ""
		h2 = .AddItem("Task 2")
		.AddBar h2,"Task",#1/5/2001#,#1/7/2001#,"K2"
		.AddLink "L1",h1,"K1",h2,"K2"
		.Link("L1",exLinkText) = "just <a1>link</a>"
	End With
End With
|
|
535
|
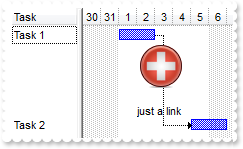
How can I display a picture or an icon on the link
With Gantt1
	.Images "gBJJgBAIDAAGAAEAAQhYAf8Pf4hh0QihCJo2AEZjQAjEZFEaIEaEEaAIAkcbk0olUrlktl0vmExmUzmk1m03nE5nU7nk9n0/oFBoVDolFo1HpFJpVLplNp1PqFRqVTq" & _
	"lVq1XrFZrVbrldr1fsFhsVjslls1ntFptVrtltt1vuFxuVzul1u13vF5vV7vl9v1/wGBwWDwmFw2HxGJxWLxmNx0xiFdyOTh8Tf9ZymXx+QytcyNgz8r0OblWjyWds+m" & _
	"0ka1Vf1ta1+r1mos2xrG2xeZ0+a0W0qOx3GO4NV3WeyvD2XJ5XL5nN51aiw+lfSj0gkUkAEllHanHI5j/cHg8EZf7w8vl8j4f/qfEZeB09/vjLAB30+kZQAP/P5/H6/y" & _
	"NAOAEAwCjMBwFAEDwJBMDwLBYAP2/8Hv8/gAGAD8LQs9w/nhDY/oygIA="
	.Columns.Add "Task"
	.Chart.FirstVisibleDate = #1/1/2001#
	With .Items
		h1 = .AddItem("Task 1")
		.AddBar h1,"Task",#1/1/2001#,#1/3/2001#,"K1"
		.AddItem ""
		.AddItem ""
		.AddItem ""
		.AddItem ""
		h2 = .AddItem("Task 2")
		.AddBar h2,"Task",#1/5/2001#,#1/7/2001#,"K2"
		.AddLink "L1",h1,"K1",h2,"K2"
		.Link("L1",exLinkText) = "just <img>1</img> link"
	End With
End With
|
|
534
|
How can I display a picture or an icon on the link
With Gantt1
	.HTMLPicture("pic1") = "c:\exontrol\images\zipdisk.gif"
	.Columns.Add "Task"
	.Chart.FirstVisibleDate = #1/1/2001#
	With .Items
		h1 = .AddItem("Task 1")
		.AddBar h1,"Task",#1/1/2001#,#1/3/2001#,"K1"
		.AddItem ""
		.AddItem ""
		.AddItem ""
		.AddItem ""
		h2 = .AddItem("Task 2")
		.AddBar h2,"Task",#1/5/2001#,#1/7/2001#,"K2"
		.AddLink "L1",h1,"K1",h2,"K2"
		.Link("L1",exLinkText) = "<img>pic1</img><br><br>just a link"
	End With
End With
|
|
533
|
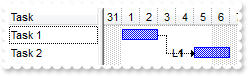
How can I display some HTML text or caption on link
With Gantt1
	.Columns.Add "Task"
	.Chart.FirstVisibleDate = #1/1/2001#
	With .Items
		h1 = .AddItem("Task 1")
		.AddBar h1,"Task",#1/1/2001#,#1/3/2001#,"K1"
		h2 = .AddItem("Task 2")
		.AddBar h2,"Task",#1/5/2001#,#1/7/2001#,"K2"
		.AddLink "L1",h1,"K1",h2,"K2"
		.Link("L1",exLinkText) = "L<b>1</b>"
	End With
End With
|
|
532
|
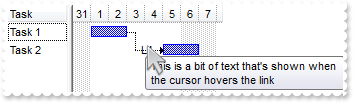
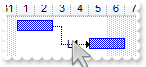
How can I assign a tooltip to a link
With Gantt1
	.Columns.Add "Task"
	.Chart.FirstVisibleDate = #1/1/2001#
	With .Items
		h1 = .AddItem("Task 1")
		.AddBar h1,"Task",#1/1/2001#,#1/3/2001#,"K1"
		h2 = .AddItem("Task 2")
		.AddBar h2,"Task",#1/5/2001#,#1/7/2001#,"K2"
		.AddLink "L1",h1,"K1",h2,"K2"
		.Link("L1",exLinkText) = "L<b>1</b>"
		.Link("L1",exLinkToolTip) = "This is a bit of text that's shown when the cursor hovers the link"
	End With
End With
|
|
531
|
Can I change the width or the size of the link
With Gantt1
	.Columns.Add "Task"
	.Chart.FirstVisibleDate = #1/1/2001#
	With .Items
		h1 = .AddItem("Task 1")
		.AddBar h1,"Task",#1/2/2001#,#1/4/2001#,"K1"
		h2 = .AddItem("Task 2")
		.AddBar h2,"Task",#1/5/2001#,#1/7/2001#,"K2"
		.AddLink "L1",h1,"K1",h2,"K2"
		.Link("L1",exLinkStyle) = 0
		.Link("L1",exLinkWidth) = 2
	End With
End With
|
|
530
|
Can I change the style of the link
With Gantt1
	.Columns.Add "Task"
	.Chart.FirstVisibleDate = #1/1/2001#
	With .Items
		h1 = .AddItem("Task 1")
		.AddBar h1,"Task",#1/2/2001#,#1/4/2001#,"K1"
		h2 = .AddItem("Task 2")
		.AddBar h2,"Task",#1/5/2001#,#1/7/2001#,"K2"
		.AddLink "L1",h1,"K1",h2,"K2"
		.Link("L1",exLinkStyle) = 4
	End With
End With
|
|
529
|
Can I change the color of the link
With Gantt1
	.Columns.Add "Task"
	.Chart.FirstVisibleDate = #1/1/2001#
	With .Items
		h1 = .AddItem("Task 1")
		.AddBar h1,"Task",#1/2/2001#,#1/4/2001#,"K1"
		h2 = .AddItem("Task 2")
		.AddBar h2,"Task",#1/5/2001#,#1/7/2001#,"K2"
		.AddLink "L1",h1,"K1",h2,"K2"
		.Link("L1",exLinkColor) = 255
	End With
End With
|
|
528
|
Can I change the part of the bar where the link ends
With Gantt1
	.Columns.Add "Task"
	.Chart.FirstVisibleDate = #1/1/2001#
	With .Items
		h1 = .AddItem("Task 1")
		.AddBar h1,"Task",#1/2/2001#,#1/4/2001#,"K1"
		h2 = .AddItem("Task 2")
		.AddBar h2,"Task",#1/5/2001#,#1/7/2001#,"K2"
		.AddLink "L1",h1,"K1",h2,"K2"
		.Link("L1",exLinkStartPos) = 1
		.Link("L1",exLinkEndPos) = 1
	End With
End With
|
|
527
|
Can I change the part of the bar where the link starts
With Gantt1
	.Columns.Add "Task"
	.Chart.FirstVisibleDate = #1/1/2001#
	With .Items
		h1 = .AddItem("Task 1")
		.AddBar h1,"Task",#1/2/2001#,#1/4/2001#,"K1"
		h2 = .AddItem("Task 2")
		.AddBar h2,"Task",#1/5/2001#,#1/7/2001#,"K2"
		.AddLink "L1",h1,"K1",h2,"K2"
		.Link("L1",exLinkStartPos) = 0
	End With
End With
|
|
526
|
How can I associate an extra data to a link
With Gantt1
	.Columns.Add "Task"
	.Chart.FirstVisibleDate = #1/1/2001#
	With .Items
		h1 = .AddItem("Task 1")
		.AddBar h1,"Task",#1/2/2001#,#1/4/2001#,"K1"
		h2 = .AddItem("Task 2")
		.AddBar h2,"Task",#1/5/2001#,#1/7/2001#,"K2"
		.AddLink "L1",h1,"K1",h2,"K2"
		.Link("L1",exLinkUserData) = "your data"
	End With
End With
|
|
525
|
How can I show or hide a specified link
With Gantt1
	.Columns.Add "Task"
	.Chart.FirstVisibleDate = #1/1/2001#
	With .Items
		h1 = .AddItem("Task 1")
		.AddBar h1,"Task",#1/2/2001#,#1/4/2001#,"K1"
		h2 = .AddItem("Task 2")
		.AddBar h2,"Task",#1/5/2001#,#1/7/2001#,"K2"
		.AddLink "L1",h1,"K1",h2,"K2"
		.Link("L1",exLinkEndBar) = False
	End With
End With
|
|
524
|
How can I get the key of the bar where the link end
With Gantt1
	.Columns.Add "Task"
	.Chart.FirstVisibleDate = #1/1/2001#
	With .Items
		h1 = .AddItem("Task 1")
		.AddBar h1,"Task",#1/2/2001#,#1/4/2001#,"K1"
		h2 = .AddItem("Task 2")
		.AddBar h2,"Task",#1/5/2001#,#1/7/2001#,"K2"
		.AddLink "L1",h1,"K1",h2,"K2"
		.AddItem .Link("L1",exLinkEndBar)
	End With
End With
|
|
523
|
How can I get the key of the bar where the link starts
With Gantt1
	.Columns.Add "Task"
	.Chart.FirstVisibleDate = #1/1/2001#
	With .Items
		h1 = .AddItem("Task 1")
		.AddBar h1,"Task",#1/2/2001#,#1/4/2001#,"K1"
		h2 = .AddItem("Task 2")
		.AddBar h2,"Task",#1/5/2001#,#1/7/2001#,"K2"
		.AddLink "L1",h1,"K1",h2,"K2"
		.AddItem .Link("L1",exLinkStartBar)
	End With
End With
|
|
522
|
How can I get the handle of the item where the link ends
With Gantt1
	.Columns.Add "Task"
	.Chart.FirstVisibleDate = #1/1/2001#
	With .Items
		h1 = .AddItem("Task 1")
		.AddBar h1,"Task",#1/2/2001#,#1/4/2001#,"K1"
		h2 = .AddItem("Task 2")
		.AddBar h2,"Task",#1/5/2001#,#1/7/2001#,"K2"
		.AddLink "L1",h1,"K1",h2,"K2"
		.AddItem .Link("L1",exLinkEndItem)
	End With
End With
|
|
521
|
How can I get the handle of the item where the link starts
With Gantt1
	.Columns.Add "Task"
	.Chart.FirstVisibleDate = #1/1/2001#
	With .Items
		h1 = .AddItem("Task 1")
		.AddBar h1,"Task",#1/2/2001#,#1/4/2001#,"K1"
		h2 = .AddItem("Task 2")
		.AddBar h2,"Task",#1/5/2001#,#1/7/2001#,"K2"
		.AddLink "L1",h1,"K1",h2,"K2"
		.AddItem .Link("L1",exLinkStartItem)
	End With
End With
|
|
520
|
How can I enumerate the links in the chart
With Gantt1
	.Columns.Add "Task"
	.Chart.FirstVisibleDate = #1/1/2001#
	With .Items
		h1 = .AddItem("Task 1")
		.AddBar h1,"Task",#1/2/2001#,#1/4/2001#,"K1"
		h2 = .AddItem("Task 2")
		.AddBar h2,"Task",#1/5/2001#,#1/7/2001#,"K2"
		.AddLink "L1",h1,"K1",h2,"K2"
		.AddLink "L2",h2,"K2",h1,"K1"
		.AddItem .FirstLink
		.AddItem .NextLink(.FirstLink)
	End With
End With
|
|
519
|
How can I access the properties and method of the link between two bars
With Gantt1
	.Columns.Add "Task"
	.Chart.FirstVisibleDate = #1/1/2001#
	With .Items
		h1 = .AddItem("Task 1")
		.AddBar h1,"Task",#1/1/2001#,#1/3/2001#,"K1"
		h2 = .AddItem("Task 2")
		.AddBar h2,"Task",#1/5/2001#,#1/7/2001#,"K2"
		.AddLink "L1",h1,"K1",h2,"K2"
		.Link("L1",exLinkText) = "L<b>1</b>"
	End With
End With
|
|
518
|
How can I remove a link between two bars
With Gantt1
	.Columns.Add "Task"
	.Chart.FirstVisibleDate = #1/1/2001#
	With .Items
		h1 = .AddItem("Task 1")
		.AddBar h1,"Task",#1/2/2001#,#1/4/2001#,"K1"
		h2 = .AddItem("Task 2")
		.AddBar h2,"Task",#1/5/2001#,#1/7/2001#,"K2"
		.AddLink "L1",h1,"K1",h2,"K2"
		.ClearLinks
	End With
End With
|
|
517
|
How can I remove a link between two bars
With Gantt1
	.Columns.Add "Task"
	.Chart.FirstVisibleDate = #1/1/2001#
	With .Items
		h1 = .AddItem("Task 1")
		.AddBar h1,"Task",#1/2/2001#,#1/4/2001#,"K1"
		h2 = .AddItem("Task 2")
		.AddBar h2,"Task",#1/5/2001#,#1/7/2001#,"K2"
		.AddLink "L1",h1,"K1",h2,"K2"
		.RemoveLink "L1"
	End With
End With
|
|
516
|
How do I add a link between two bars
With Gantt1
	.Columns.Add "Task"
	.Chart.FirstVisibleDate = #1/1/2001#
	With .Items
		h1 = .AddItem("Task 1")
		.AddBar h1,"Task",#1/2/2001#,#1/4/2001#,"K1"
		h2 = .AddItem("Task 2")
		.AddBar h2,"Task",#1/5/2001#,#1/7/2001#,"K2"
		.AddLink "L1",h1,"K1",h2,"K2"
	End With
End With
|
|
515
|
How do I find the number or count of bars in the item
With Gantt1
	.Columns.Add "Task"
	.Chart.FirstVisibleDate = #1/1/2001#
	With .Items
		h = .AddItem("Task 1")
		.AddBar h,"Task",#1/1/2001#,#1/2/2001#,"K1"
		.AddBar h,"Task",#1/4/2001#,#1/6/2001#,"K2"
		.ItemBar(h,"K2",exBarCaption) = .ItemBar(h,,exBarsCount)
	End With
End With
|
|
514
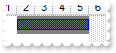
|
How can I assign any extra data to a bar in the chart
With Gantt1
	.Columns.Add "Task"
	.Chart.FirstVisibleDate = #1/1/2001#
	With .Items
		h = .AddItem("Task 1")
		.AddBar h,"Task",#1/2/2001#,#1/6/2001#,"K1"
		.ItemBar(h,"K1",exBarPattern) = "your data"
	End With
End With
|
|
513
|
Is there any way to change the background color for percent value being displayed on the progress bar
With Gantt1
	.Columns.Add "Task"
	.Chart.FirstVisibleDate = #1/1/2001#
	.Chart.Bars.Add("Task%Progress").Shortcut = "Percent"
	With .Items
		h = .AddItem("Task 1")
		.AddBar h,"Percent",#1/2/2001#,#1/6/2001#,"K1"
		.ItemBar(h,"K1",exBarPercent) = 0.35
		.ItemBar(h,"K1",exBarShowPercentCaption) = True
		.ItemBar(h,"K1",exBarPercentCaptionFormat) = "<bgcolor=FF0000> %p%</bgcolor>"
	End With
End With
|
|
512
|
Is there any way to change the color for percent value being displayed on the progress bar
With Gantt1
	.Columns.Add "Task"
	.Chart.FirstVisibleDate = #1/1/2001#
	.Chart.Bars.Add("Task%Progress").Shortcut = "Percent"
	With .Items
		h = .AddItem("Task 1")
		.AddBar h,"Percent",#1/2/2001#,#1/6/2001#,"K1"
		.ItemBar(h,"K1",exBarPercent) = 0.35
		.ItemBar(h,"K1",exBarShowPercentCaption) = True
		.ItemBar(h,"K1",exBarPercentCaptionFormat) = "<fgcolor=FF0000>%p%</fgcolor>"
	End With
End With
|
|
511
|
Is there any way to change the font for percent value being displayed on the progress bar
With Gantt1
	.Columns.Add "Task"
	.Chart.FirstVisibleDate = #1/1/2001#
	.Chart.Bars.Add("Task%Progress").Shortcut = "Percent"
	With .Items
		h = .AddItem("Task 1")
		.AddBar h,"Percent",#1/2/2001#,#1/6/2001#,"K1"
		.ItemBar(h,"K1",exBarPercent) = 0.35
		.ItemBar(h,"K1",exBarShowPercentCaption) = True
		.ItemBar(h,"K1",exBarPercentCaptionFormat) = "<b><font Tahoma;12>%%p</font></b>"
	End With
End With
|
|
510
|
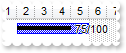
Is there any way to align the percent value being displayed on the progress bar
With Gantt1
	.Columns.Add "Task"
	.Chart.FirstVisibleDate = #1/1/2001#
	.Chart.Bars.Add("Task%Progress").Shortcut = "Percent"
	With .Items
		h = .AddItem("Task 1")
		.AddBar h,"Percent",#1/2/2001#,#1/6/2001#,"K1"
		.ItemBar(h,"K1",exBarPercent) = 0.75
		.ItemBar(h,"K1",exBarShowPercentCaption) = True
		.ItemBar(h,"K1",exBarPercentCaptionFormat) = "%p/100"
		.ItemBar(h,"K1",exBarOffset) = 0
	End With
End With
|
|
509
|
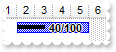
Is there any way to change the format of the percent being displayed on the progress bar
With Gantt1
	.Columns.Add "Task"
	.Chart.FirstVisibleDate = #1/1/2001#
	.Chart.Bars.Add("Task%Progress").Shortcut = "Percent"
	With .Items
		h = .AddItem("Task 1")
		.AddBar h,"Percent",#1/2/2001#,#1/6/2001#,"K1"
		.ItemBar(h,"K1",exBarPercent) = 0.4
		.ItemBar(h,"K1",exBarShowPercentCaption) = True
		.ItemBar(h,"K1",exBarPercentCaptionFormat) = "<b>%p/100</b>"
	End With
End With
|
|
508
|
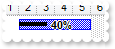
How can I show or hide the percent value in the progress bar
With Gantt1
	.Columns.Add "Task"
	.Chart.FirstVisibleDate = #1/1/2001#
	.Chart.Bars.Add("Task%Progress").Shortcut = "Percent"
	With .Items
		h = .AddItem("Task 1")
		.AddBar h,"Percent",#1/2/2001#,#1/6/2001#,"K1"
		.ItemBar(h,"K1",exBarPercent) = 0.4
		.ItemBar(h,"K1",exBarShowPercentCaption) = True
	End With
End With
|
|
507
|
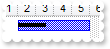
How can I change the percent value in a progress bar
With Gantt1
	.Columns.Add "Task"
	.Chart.FirstVisibleDate = #1/1/2001#
	.Chart.Bars.Add("Task%Progress").Shortcut = "Percent"
	With .Items
		h = .AddItem("Task 1")
		.AddBar h,"Percent",#1/2/2001#,#1/6/2001#,"K1"
		.ItemBar(h,"K1",exBarPercent) = 0.4
	End With
End With
|
|
506
|
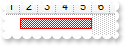
How can I add a percent bar
With Gantt1
	.Columns.Add "Task"
	.Chart.FirstVisibleDate = #1/1/2001#
	.Chart.Bars.Add "Task%Progress"
	With .Items
		h = .AddItem("Task 1")
		.AddBar h,"Task%Progress",#1/2/2001#,#1/6/2001#,"K1"
		.ItemBar(h,"K1",exBarPercent) = 0.4
	End With
End With
|
|
505
|
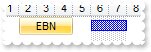
Can I add a bar in the chart, using your EBN files
With Gantt1
	.VisualAppearance.Add 1,"c:\exontrol\images\normal.ebn"
	.Columns.Add "Task"
	.Chart.FirstVisibleDate = #1/1/2001#
	With .Items
		h = .AddItem("Task 1")
		.AddBar h,"",#1/2/2001#,#1/5/2001#,"K1"," EBN "
		.ItemBar(h,"K1",exBarBackColor) = 16777216
		.AddBar h,"Task",#1/6/2001#,#1/8/2001#,"K2"
	End With
End With
|
|
504
|
How can I change the background color of the bar in the chart
With Gantt1
	.Columns.Add "Task"
	.Chart.FirstVisibleDate = #1/1/2001#
	.Chart.Bars.Copy("Task","TaskR").Color = RGB(255,0,0)
	With .Items
		h = .AddItem("Task 1")
		.AddBar h,"TaskR",#1/2/2001#,#1/6/2001#,"K1"
	End With
End With
|
|
503
|
How can I change the background color of the bar in the chart
With Gantt1
	.Columns.Add "Task"
	.Chart.FirstVisibleDate = #1/1/2001#
	With .Items
		h = .AddItem("Task 1")
		.AddBar h,"Task",#1/2/2001#,#1/6/2001#,"K1"
		.ItemBar(h,"K1",exBarBackColor) = 8421504
	End With
End With
|
|
502
|
How can I change the background color of the HTML text or caption of the bar in the chart
With Gantt1
	.Columns.Add "Task"
	.Chart.FirstVisibleDate = #1/1/2001#
	With .Items
		h = .AddItem("Task 1")
		.AddBar h,"Task",#1/2/2001#,#1/6/2001#,"K1"
		.ItemBar(h,"K1",exBarCaption) = "<bgcolor=FF0000> to do </bgcolor>"
	End With
End With
|
|
501
|
How can I change the foreground color of the HTML text or caption of the bar in the chart
With Gantt1
	.Columns.Add "Task"
	.Chart.FirstVisibleDate = #1/1/2001#
	With .Items
		h = .AddItem("Task 1")
		.AddBar h,"Task",#1/2/2001#,#1/6/2001#,"K1","t<fgcolor=0000FF>o</fgcolor> do"
		.ItemBar(h,"K1",exBarForeColor) = 16777215
	End With
End With
|